Networks and Mapping
The General Land Office required homesteaders to print a "proof of posting" in a local newspaper for five consecutive weeks, that signaled their intent to "prove up." The posting included a legal description of the land and a list of four local community members who could positively testify that the applicant was a bona fide homesteader, thus yielding four known socio-legal connections for each homesteader.
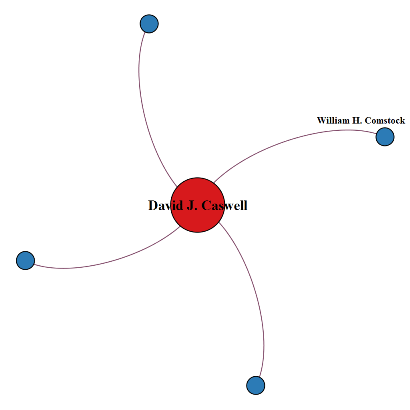
Put simply, networks are graphs that visualize the relationship between entities. Graphs are comprised of nodes and edges. In our graphs, nodes represent people (homesteaders and witnesses) and edges represent a socio-legal relationship built off of the practice of witnessing, as in the case of David J. Caswell. When we include the connections in the township for all Caswell's witnesses, the network builds outward.
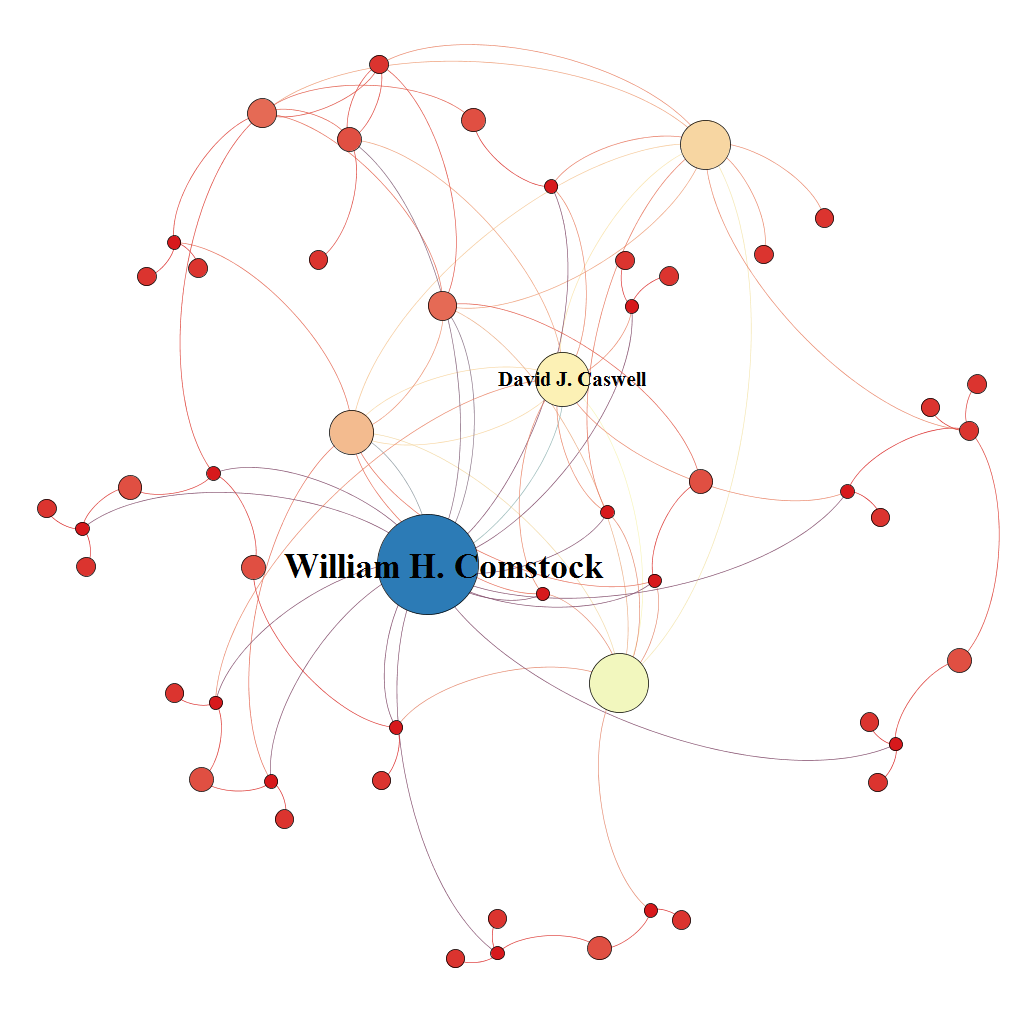
Leadership: Some homesteaders witnessed for neighbors and friends with far more frequency than others. These keystone individuals in the community emerge based on in-degree, or the frequency with which he/she is listed as a potential witness. As in the previous example, Caswell loses his centrality and importance as the network expands and Comstock emerges as a keystone individual when we ran in-degree metrics. Qualitative research into the top three community leaders for each township revealed that leadership was primarily based on longevity of residence, and these "old settlers" of the region also shouldered the majority of the civic duties required to create a social and economic infrastructure. Larger nodes demarcate a higher in-degree.
Community: Homesteaders divided themselves into close-knit community networks. The graphs color-coding community formation use modularity, a "community detection algorithm" designed by Gephi. Node size still represents leadership through in-degree. Our graphs reveal that each township developed approximately 8-9 distinct yet intersecting communities.
Geography: To aid our investigation into community formation within the Study Area, we georeferenced the witness networks using historic survey maps and the legal descriptions of the homestead claims. Community typically formed based on proximity; homesteaders imagined themselves as part of rural "neighborhoods." In some cases, however, immigrant groups formed intentional communities. The graphs show that central Europeans often exclusively witnessed for one another rather than integrating with the local non-immigrant community. The following networks use in-degree (node size) and modularity (color). The nodes unassigned to a geographic location (i.e. not homesteaders in the township) float along the top of the screen.
We have also created an interactive map of our study area with the help of Robert C. Shepard. The dataset is available for download here (500MB): maps_homesteading.zip. We invite you to explore the Custer County map and Dawes County map.